
A twist on an urn problem at The Riddler
Over at FiveThirtyEight, this week’s Riddler Classic question truly is a “classic” varietal: a problem about drawing colored balls selected from an urn. We are told:
You have an urn with an equal number of red balls and white balls, but you have no information about what that number might be. You draw 19 balls at random, without replacement, and you get eight red balls and 11 white balls. What is your best guess for the original number of balls (red and white) in the urn?
In a typical Bayesian inference problem, we’re asked: given some knowledge on the state of the world, after having observed some new data, how do we update our knowledge? This is not a question of the same form; it’s asking us the converse! Given some data, what’s your best estimate on the state of the world?
Likelihood
For a question of this type, the key concept that guides us toward the solution to this problem is likelihood. If one is used to thinking in terms of probabilities, likelihood can be difficult to wrap one’s head around. The most intuitive explanation I’ve found comes from an article by Alexander Etz. He writes: “Likelihood is a strange concept, in that it is not a probability, but it is proportional to a probability. The likelihood of a hypothesis (H) given some data (D) is proportional to the probability of obtaining D given that H is true. … For conditional probability, the hypothesis is treated as a given and the data are free to vary. For likelihood, the data are treated as a given and the hypotheses vary.”
For our problem, the data are fixed (19 balls are chosen without replacement, we draw 8 red balls and 11 white balls) and the best hypothesis is what we’re interested in solving for (how many balls are there?). As Etz writes above, we can find the likelihood for a given hypothesis by calculating the probability of obtaining our data from that hypothesis.
Before going any further, what do we know about the answer? We can deduce two restrictions:
- There must be at least 22 balls. We selected 11 white balls and there are an equivalent number of red balls, so there are at least 11 red balls too.
- The number of balls must be even. Otherwise the number of red and white balls could not be equivalent.
So before moving on we’ve already limited our potential solutions.
Using the hypergeometric distribution
Let’s start by considering the case of 22 balls and assume this is the true state of the world for now.
We want to ask: what’s the probability of obtaining the result we observed, given that there are 22 balls in the urn (11 white and 11 red)? Some readers may be familiar with applying the binomial distribution for these types of problems, but the binomial distribution can only be used for probability problems with replacement, such as flipping the same coin multiple times. Instead we can use a related probability distribution, the hypergeometric distribution, for problems without replacement.
The formula for solving for the relevant probability under the hypergeometric distribution is somewhat complex — rather than reproduce it here, I’ll link to the Wikipedia definition for the probability mass function, where it’s explained in full. To solve our problem we’ll be wanting to run the formula multiple times anyway, so to do the actual calculations we can turn to Python and the “hypergeom“ module (part of the SciPy package).
From our inputs in the problem, we calculate (code available here) that there is a 10.7% probability of attaining the data we observed if there were 22 balls. This probability is equivalent to the likelihood. But the likelihood, by itself, has no interpretation — it is interpreted in comparison to other likelihoods from other potential hypotheses.
The likelihood from different hypotheses can be interpreted as a ratio — for example, if the 22-ball hypothesis has a likelihood of 10.7%, and let’s say an alternate hypothesis has a likelihood of 21.4%, the alternate hypothesis would be twice as likely as the 22-ball hypothesis.
We’re interested in finding the hypothesis resulting in the maximum likelihood, which will be our answer.
Finding maximum likelihood
We ran the likelihood calculation on the 22-ball case, but we can run the same calculation on the 24-ball case, the 26-ball case, and so on. The number of balls in the urn might be very high, but let’s start by running from 22 balls up to 60 balls to see what we find.
From our code that does this, we can create the graph below:
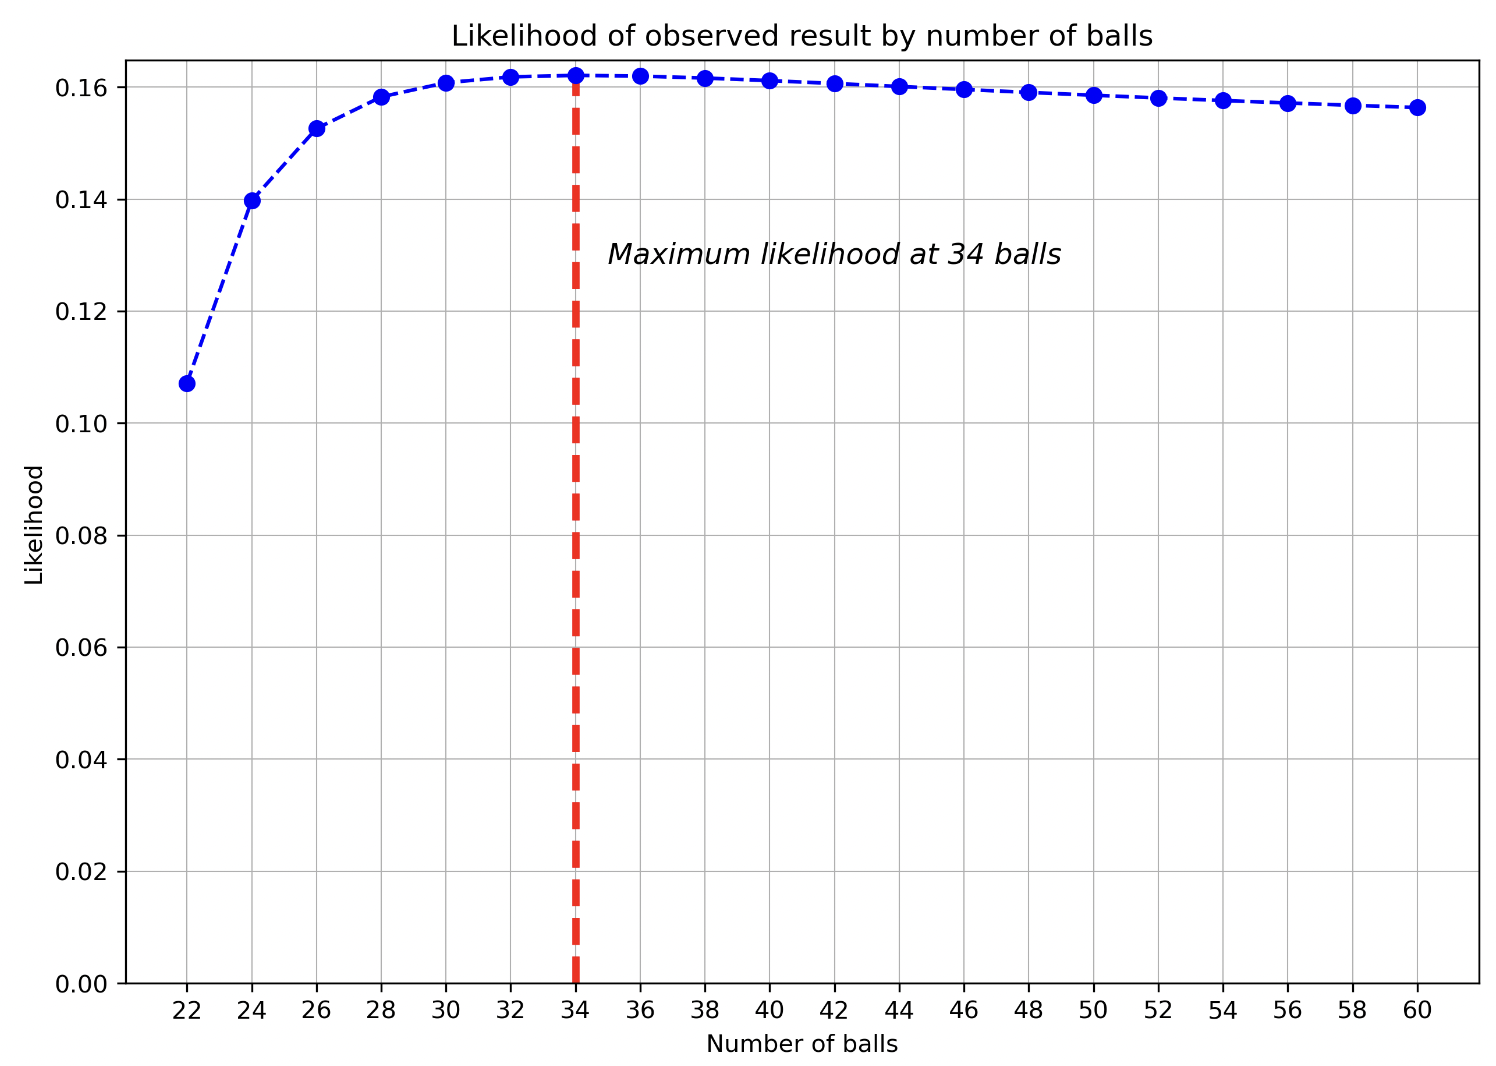
Our maximum likelihood so far is at 34 balls — though it’s quite close to 32 balls and 36 balls so is hard to discern visually. We see the shape of the curve rise from 22 balls to find a maximum at 34, then start declining.
My intuition for this result is as follows: the 22-ball case is less likely than others because this requires every single white ball in the urn being selected. This will be less likely than hypotheses in which there’s more possible “solutions” to draw the 11 white balls selected.
At the other extreme, what if there were a near-infinite number of balls? As the number of balls approaches infinity, we’d expect the number of red balls selected to become closer and closer to 50%, because it makes the fact that balls are selected without replacement matter less and less. If there were an infinite number of balls, replacement would effectively occur! Our actual data doesn’t have 50% red balls, so by adding more balls to the urn, it makes our observed data less likely.
Thus the answer ends up somewhere in the middle (34) — greater than the minimum number of balls, and less than infinity.
Rather than stopping at 60 balls, let’s compute the first 10,000 and see if this logic seems to hold up.
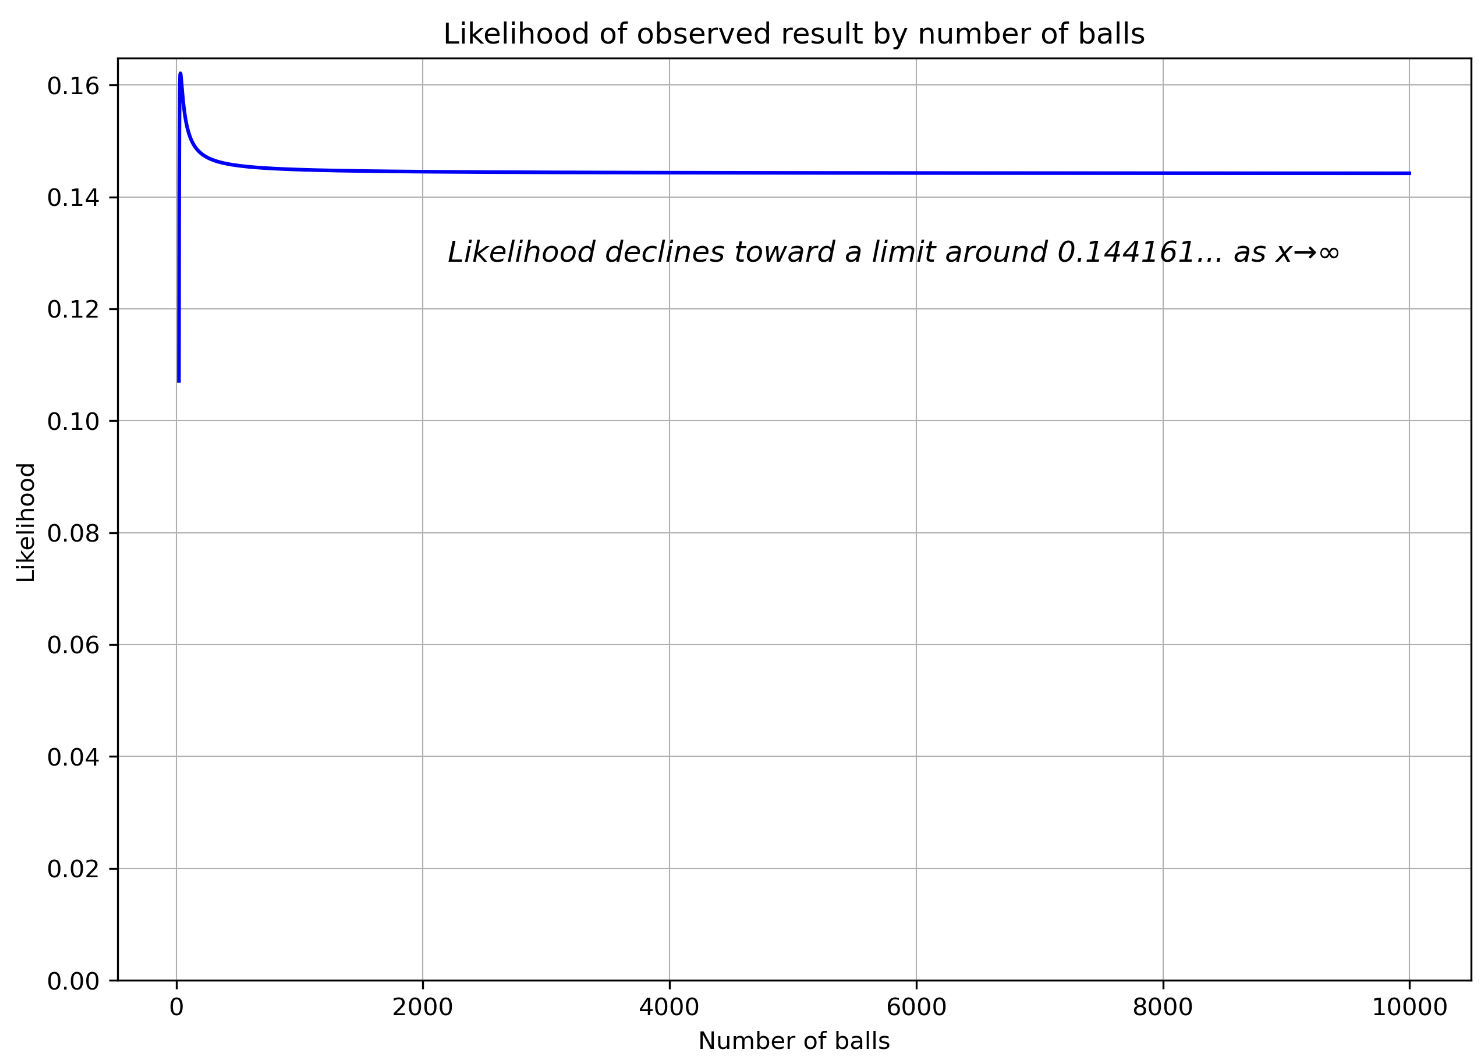
Seems to make sense — and though we haven’t tested an infinite number of balls, based on the logic above, we’re comfortable saying our answer is 34. While the graph does appear to show a flat likelihood past a certain number of balls, as the number of balls approaches infinity, the likelihood does in fact continue to decline! Around the 10,000 ball, each successive two balls makes the likelihood go down in the 8th decimal place! At 10^18 balls — the maximum I was able to successfully calculate — the likelihood approaches 0.1441612243652294, so it’s likely there’s a limit around there.
One note on these graphs: likelihoods aren’t probabilities, which is why the likelihood of every data point doesn’t add up to 100%. Each data point is about a given hypothesis, and we could test an infinite number of hypotheses.