
How many votes does it take to change the outcome of a U.S. presidential election?
How “close” was the 2020 U.S. presidential election? There are several ways to approach the question: for instance, one can cite the popular vote (Joe Biden won by 7,052,770 votes, or by a margin of 4.4%) or the electoral college margin (Biden won 306 electoral votes to Trump’s 232). But if we focus on the closeness of the outcome of the election — who ended up in the White House — neither of these metrics tell us very much alone. The popular vote is irrelevant in a system governed by the institution of the electoral college (popular vote is not how the election is decided), and the overall electoral college margin can obscure the within-state vote margins that provide tipping points for the election’s outcome.
I suggest that the best measure of the closeness of a given U.S. presidential election is what I’ll call the flip margin: the minimum number of voters required to change their vote such that the presidential election has a different winner.
Below, I’ll describe the calculation of flip margin and share comparative results for all presidential elections since 1976. As I’ll show, recent elections have had their flip margins relatively uncorrelated to popular vote margins. This analysis is one more piece of evidence in support of abolishing the increasingly anti-democratic Electoral College.
Methodology: Calculating flip margin
Computing flip margin requires us to find a “route” to an electoral college majority for a given losing candidate by “flipping” voters (getting them to change their vote from the winner to the loser). More specifically, we need to consider three quantities:
- For each state that was lost, the within-state flip margin (effectively: the state winner’s number of votes minus the loser’s number of votes, divided by two).
- For each state that was lost, their number of electoral votes
- The total number of electoral votes that the losing candidate needs to take from the winner in order to change the outcome of the election
We’re interested in locating the route to changing the election result that requires the smallest number of flipped votes. This is an optimization problem: we want to find the collection of states that minimizes the sum of within-state flip margins (quantity 1) while still having their sum of total electoral votes (quantity 2) exceed the needed electoral vote margin to make up (quantity 3).
As it turns out, this is a variant of a famous problem in computer science and operations research: the “knapsack problem.” For some small datasets, the solutions can be eyeballed easily enough – for instance, it was widely reported that in 2016, Trump won the presidency by eking out wins in Michigan, Pennsylvania, and Wisconsin. But for larger datasets with more complex solutions (such as Ronald Reagan’s landslide victory over Walter Mondale in 1984), we need to write an algorithm to find the correct path as the solution would be extraordinarily difficult to find “by hand.” I compute the results by writing a knapsack-variant solver for presidential election datasets taken from the MIT Election Data and Science Lab and U.S. National Archive (code and technical notes are below).
Results
We can first take a look at the overall flip margins by year:
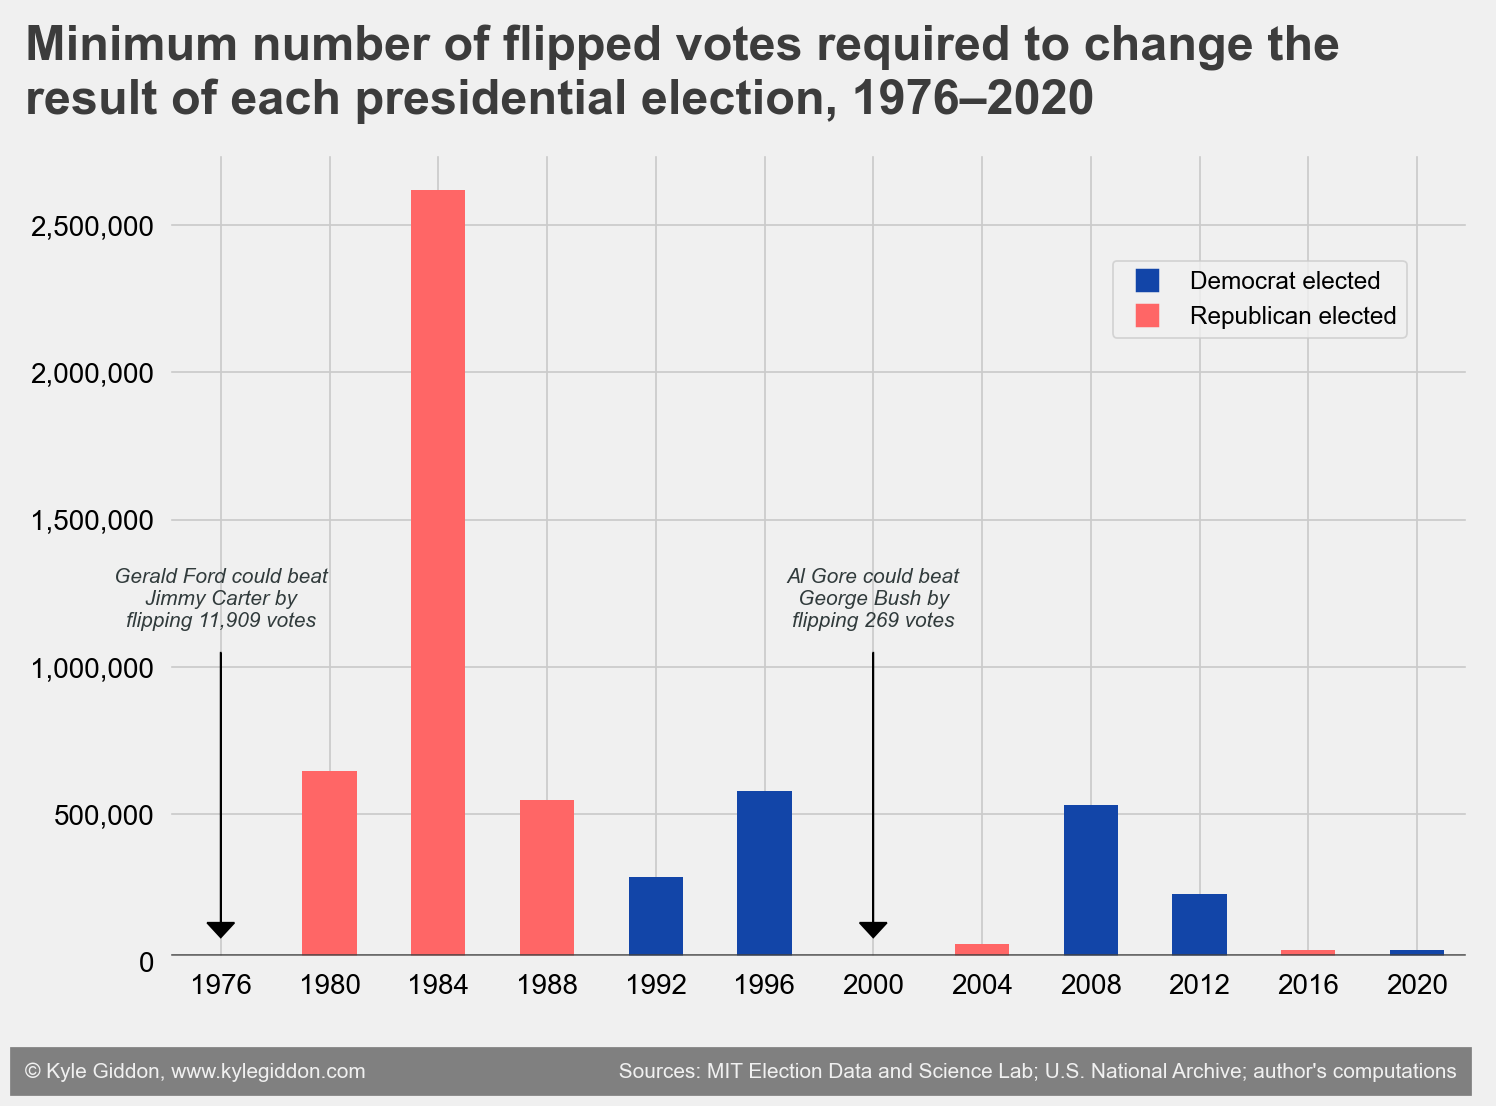
It’s no surprise that the smallest flip margin comes from the contested 2000 election, in which the US Supreme Court ruled to finalize the Florida election count that George W. Bush won by 537 votes (a state’s flip margin will be half the winner’s victory margin in that state, because the loser “takes” votes from the winner). Less well known might be the 1976 election, in which Jimmy Carter defeated Gerald Ford by a flip margin of less than 12,000 votes, even though he was ahead in the popular vote by over 2 percentage points.
Which states are needed? The Table below shows the states needed to be flipped in each losing candidate’s flipped route to victory:
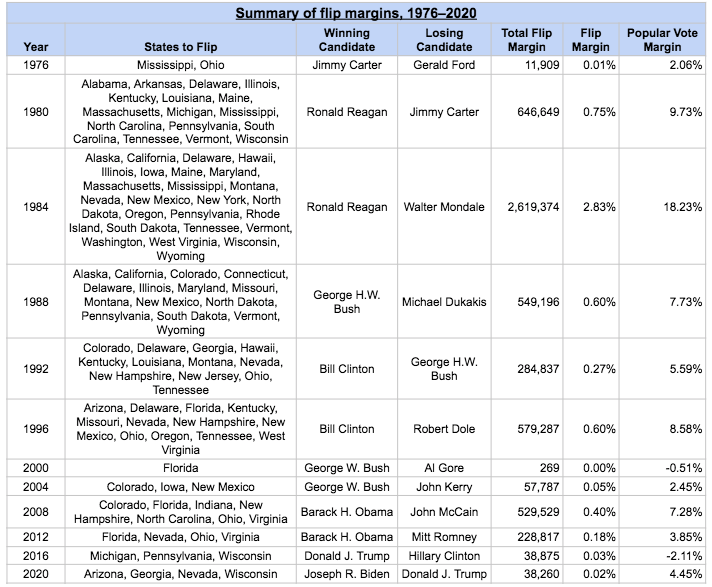
Florida has not figured prominently as a tipping state in the last two elections (after appearing in the flipped list in 3 of the preceding 4 elections). Trump took Florida by over 370,000 votes in 2020 and 100,000 votes in 2016.
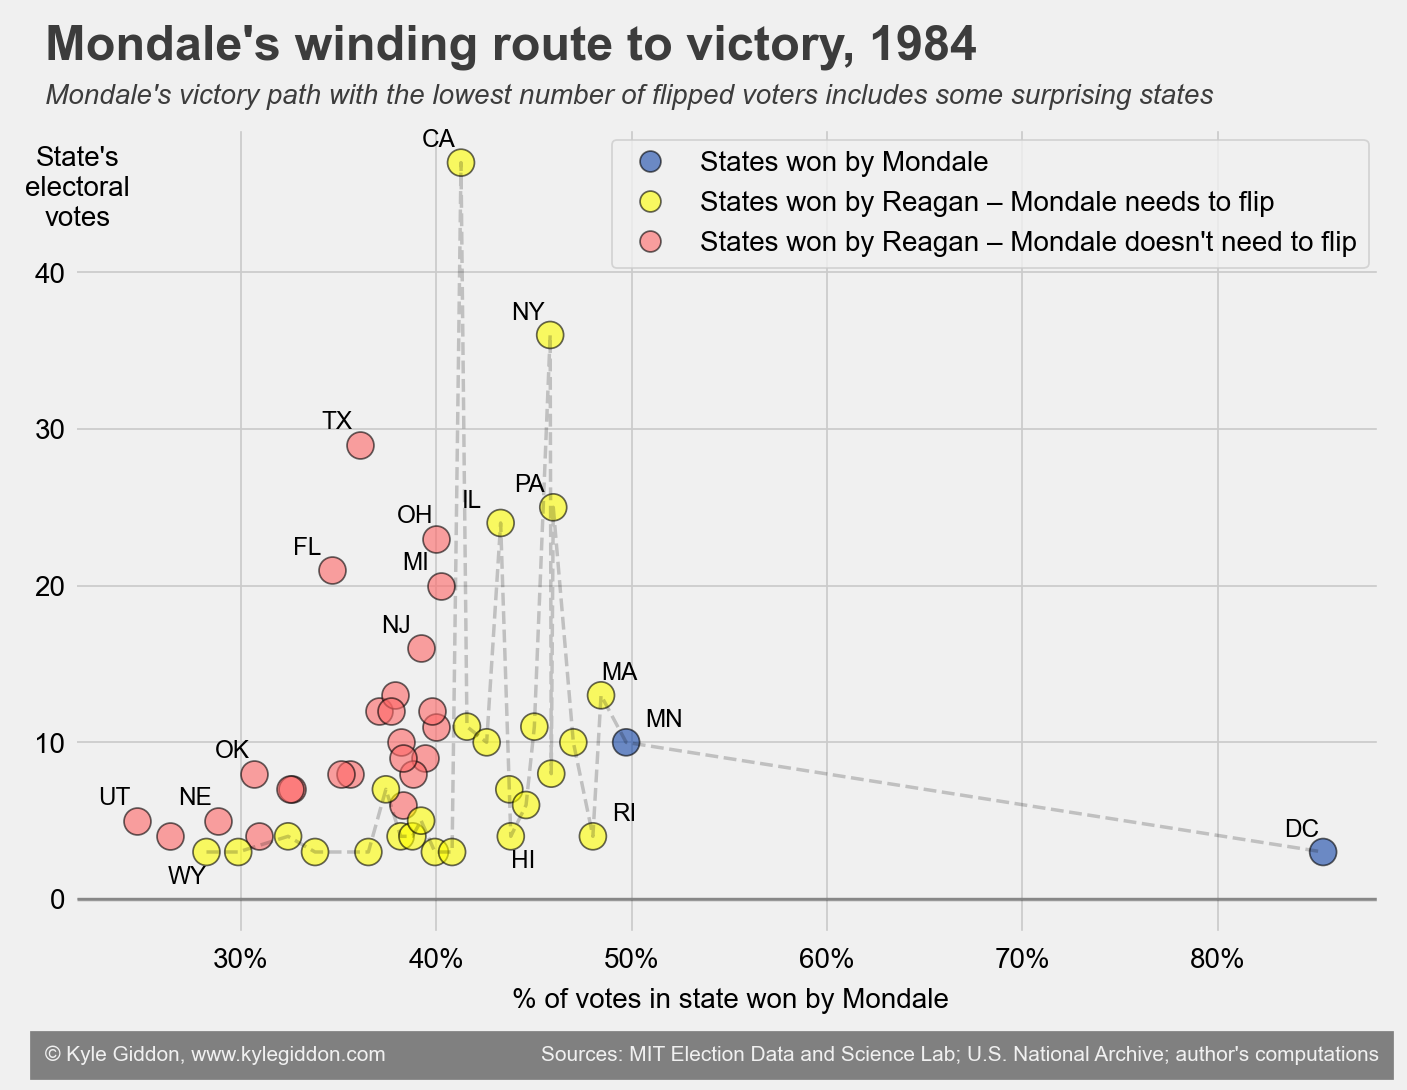
Reagan’s landslide 1984 victory bears some closer examination. Mondale won only Minnesota and Washington, DC. How can he flip the result?
The graph below shows Mondale’s “fewest flipped votes” path to victory, comparing the number of electoral votes in each state to Mondale’s percentage of votes in that state. Notably, Mondale’s best route includes states like Wyoming where he performed poorly (where he had his third-lowest margin) and ignores larger states such as Michigan because their higher populations mean the number of votes required to flip them would be too high.
Finally, we can take a look at the relationship between popular vote margin and flip margin by year. Because the number of overall votes has increased over time (nearly doubling from 81 million in 1976 to 159 million in 2020), we’ll compare popular vote margin to flip margin percentage (the flip margin as a percentage of all votes) to better normalize across years:
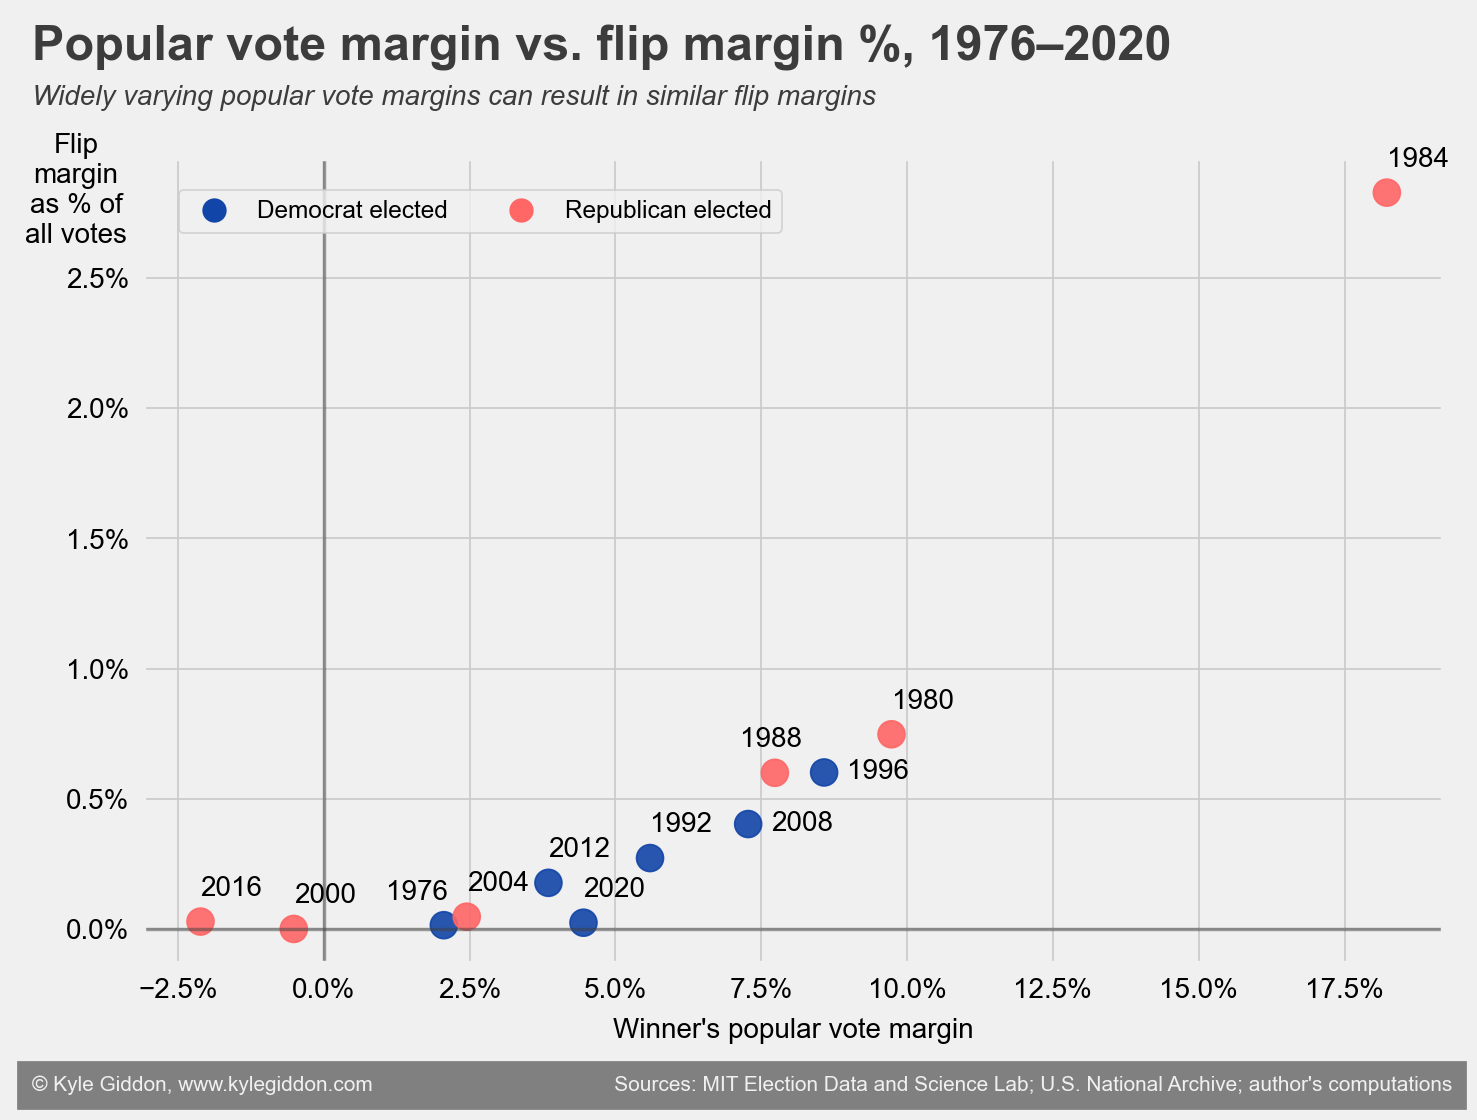
The 1984 election again stands out as an outlier. Every other election since 1976 has had a flip margin percentage under 1% despite a wide range of popular vote margin results. (Of course, because flip margins rely on an optimized route to overturn an election result, their exact route is unlikely to be achieved in practice.)
Looking at the progression over time of the above data, in recent years the flip margin has become increasingly detached from the popular vote margin. Obviously, two of the last five elections have been won by the popular vote loser, but flip margin examples in 1976 and 2020 also show how close these elections were as well.
Conclusion
The anti-democratic bias of the Electoral College has been widely written about, and its structural flaws have reached the point where any good-faith argument for its tenancy is basically impossible to make (vs. a national popular vote). We’ve been pushed past the brink – a popular vote loser in the White House – two times in recent history, and as the analysis above shows, we’ve neared it several more times, saved only by the “correct quasi-arbitrary distribution of voters in state political boundaries.
One would hope that Electoral College Reform features prominently on any progressive political agenda. Unfortunately, because its implementation provides a large structural advantage to one political party (which holds veto points), one would think reform is unlikely to happen soon.
Technical appendix
Code
The full code is available on GitHub.
Data sources
Data are taken from two sources, and compiled into the data folder here:
- The Massachusetts Institute of Technology Election Data and Science Lab provides state-level returns by year. Data is downloadable as a .tab file.
- The U.S. National Archive tracks the number of electoral votes for each state in each election. Each year is on its own web page in a table. I manually copied and pasted each yearly table into a CSV.
Nebraska and Maine problem
Maine (since 1972) and Nebraska (since 1992) do not award all their electoral votes to the popular vote winner of the state. Instead, they allocate two electoral votes to the state popular vote winner, and then one electoral vote to the popular vote winner in each congressional district (2 in Maine, 3 in Nebraska).1 This presents challenges for our knapsack algorithm solver. If each state only conducted allocation by congressional district winners, this would be simple enough to account for (we would effectively just treat these as separate states). But each vote effectively counts twice – in the congressional district allocation and in the overall state calculation.
In the initial implementation above, I ignore this complexity and instead treat Maine and Nebraska as the other states (winner take all). This results in the analysis above potentially losing some accuracy, as candidates may find a better route to flipping the outcome by siphoning some congressional district votes in Maine and Nebraska. For 2000, 2016, and 2020, we can manually check results easily enough and know that this wouldn’t affect the flip margin outcomes, but we can’t be sure for other years without extending the algorithm to account for this.
We can likely integrate this unique feature into the knapsack solver by pre-computing, for each election, the total number of electoral votes won by each candidate in Maine and Nebraska for any allocation of votes in each congressional district. This is likely worth revisiting but I haven’t done so in the first implementation. I’ll update this post upon addressing.
Miscellaneous notes / footnotes
I do not consider faithless electors in any calculations.
-
See article on 270 to Win. ↩