
Metrics versus the monster
Note: This post is intended for practioners of experiment and A/B test evaluation in technology settings. I argue that proposed product changes that increase a target metric while reducing a participation metric (e.g., daily active users) should require elevated scrutiny.
Let’s say we manage a product surface within a social media app that involves some type of ranking algorithm – for example, a Recommended Content Feed. Let’s also assume:
- One of our main target metrics on the team for our product is Total Clickthroughs (TC) onto recommended content.
- The Recommended Content Feed is hidden behind another surface, so it has to be actively navigated to by the user (e.g., via a top navigation menu).
Now, we run an experiment (A/B test) that affects the ranking algorithm, setting up a test group (users with the new algorithm) and comparing against a control group (users with the old algorithm). We analyze the experiment and see the following results in our test group:
- An increase in the number of Total Clickthroughs
- An increase in average user latency while loading the the Recommended Content Feed
- A decrease in daily active users (DAU) that reach and load the Recommended Content Feed
This is a realistic scenario because if we add better signals to ranking algorithms, the addition of these signals may come at a latency cost. Let’s say from prior research, we know as well that the decrease in active users on our product surface is driven directly by latency – fewer users are becoming active on our surface because they’re clicking off the surface before they load it.
What do we do here – do we ship this new algorithm or not?
The short answer is that we can evaluate the tradeoff of an increase in Total Clickthroughs vs. a latency-driven decrease in DAU, and decide whether the Total Clickthroughs increase is worth the cost of latency/DAU. Based on the specific metrics that are being traded off, we might have ways of estimating some transfer function so we can convert them to the same units and do a more rigorous evaluation, or we might not have a transfer function and have to rely on a more qualitative apples vs. oranges comparison.
The longer answer is that we do the same thing (evaluate the tradeoffs), but we need to be conscious of the distributional effects across the user base.
Distributional effects and the utility monster
For example, if we have fewer users doing x number of Total Clickthroughs, maybe this is “less good” (in terms of its total ecosystem value to our app) than more users doing y number of Total Clickthroughs (where x > y). That is, there may be diminishing marginal returns to Total Clickthroughs on the user level that justify a product choice with fewer total Total Clickthroughs.
Let’s say we two users, User A and User B. We have a choice of two ranking algorithms for media. Algorithm 1 leads to User A doing one Total Clickthrough, and User B doing one Total Clickthrough. Algorithm leads only leads to User A doing two Total Clickthroughs:
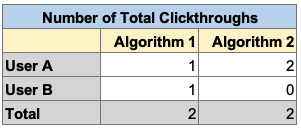
Which of these two algorithms do we prefer? They have the same total number of Total Clickthroughs. But in this case, we’d likely prefer Algorithm 1 because:
- The Total Clickthroughs are spread across more users …
- … and we think this will make more users “happy” …
- … and we surmise that making more users happy has superior ecosystem effects for our app (not just our surface).
We can frame this in the concept of diminishing marginal returns: a user’s Nth Total Clickthrough provides less ecosystem value than their (N-1)th Total Clickthrough. We can formalize the concept by converting these metrics to “utility” as a unit of ecosystem value. Each Total Clickthroughs gets converted to its utility, and then we can sum the utilities of Algorithm 1 vs. Algorithm 2.
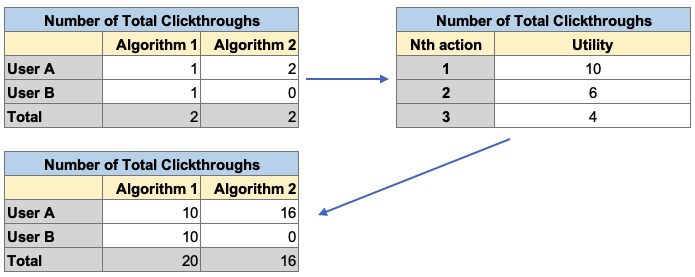
When we introduce the diminishing marginal returns of Total Clickthroughs, we can see that Algorithm 1 outperforms Algorithm 2 in terms of total ecosystem value (utility), and we now more formally justify choosing Algorithm 1. While Algorithm 1 and Algorithm 2 have the same total number of Total Clickthroughs, a similar example could show that an algorithm with fewer Total Clickthroughs outperforms an algorithm with more Total Clickthroughs.
To take the concept even further, we can bring in the utility monster. The utility monster is a concept invented by the political philosopher Robert Nozick in 1974:
A hypothetical being, which Nozick calls the utility monster, receives much more utility from each unit of a resource they consume than anyone else does. For instance, eating a cookie might bring only one unit of pleasure to an ordinary person but could bring 100 units of pleasure to a utility monster. If the utility monster can get so much pleasure from each unit of resources, it follows from utilitarianism that the distribution of resources should acknowledge this. If the utility monster existed, it would justify the mistreatment and perhaps annihilation of everyone else, according to the mandates of utilitarianism, because, for the utility monster, the pleasure they receive outweighs the suffering they may cause.
The utility monster is an exaggerated version of what can happen through naive shipping decisions based only on a target metric. By sacrificing latency and DAU we might risk creating “Recommended Content Feed utility monsters” who do tons of Total Clickthroughs, while we worsen the experience for a substantial segment of the population. The impact of a marginal Total Clickthrough is likely greatest if spread across a greater number of users. If we looked at Total Clickthroughs exclusively without considering distributional effects, we theoretically could be unknowingly creating a Recommended Content Feed experience that only caters to a smaller segment of utility monsters (e.g., users who don’t care about latency), with ecosystem affects that only become apparent later down the line.
How do we incorporate this into our decision-making?
The most sophisticated way of dealing with this challenge is always looking at user-distributional effects, finding some way to construct the marginal returns curve for metric X, and converting every metric to its total utility after considering marginal/distributional effects (as we did above for the Algorithm 1 vs. Algorithm 2). But that is difficult and likely overkill for the vast majority of use cases (assuming a time-constrained analytics team with competing priorities).
I suggest a shorthand that if target metric X (e.g., Total Clickthroughs) increases and a participation metric (e.g. DAU) is neutral or positive, an Analyst can largely ignore distributional effects. If target metric X (e.g., Total Clickthroughs) increases and a participation metric (e.g. DAU) decreases, you should apply special scrutiny. What is the magnitude of the DAU decrease? How much do we care about this when traded off against the increase in the target metric?
At this point – you may be back to the short-answer of having to make qualitative tradeoffs. But we’ve now formalized an approach to considering these tradeoffs and, if needed, can create specific follow-up questions can be answered empirically to help inform a shipping decision.